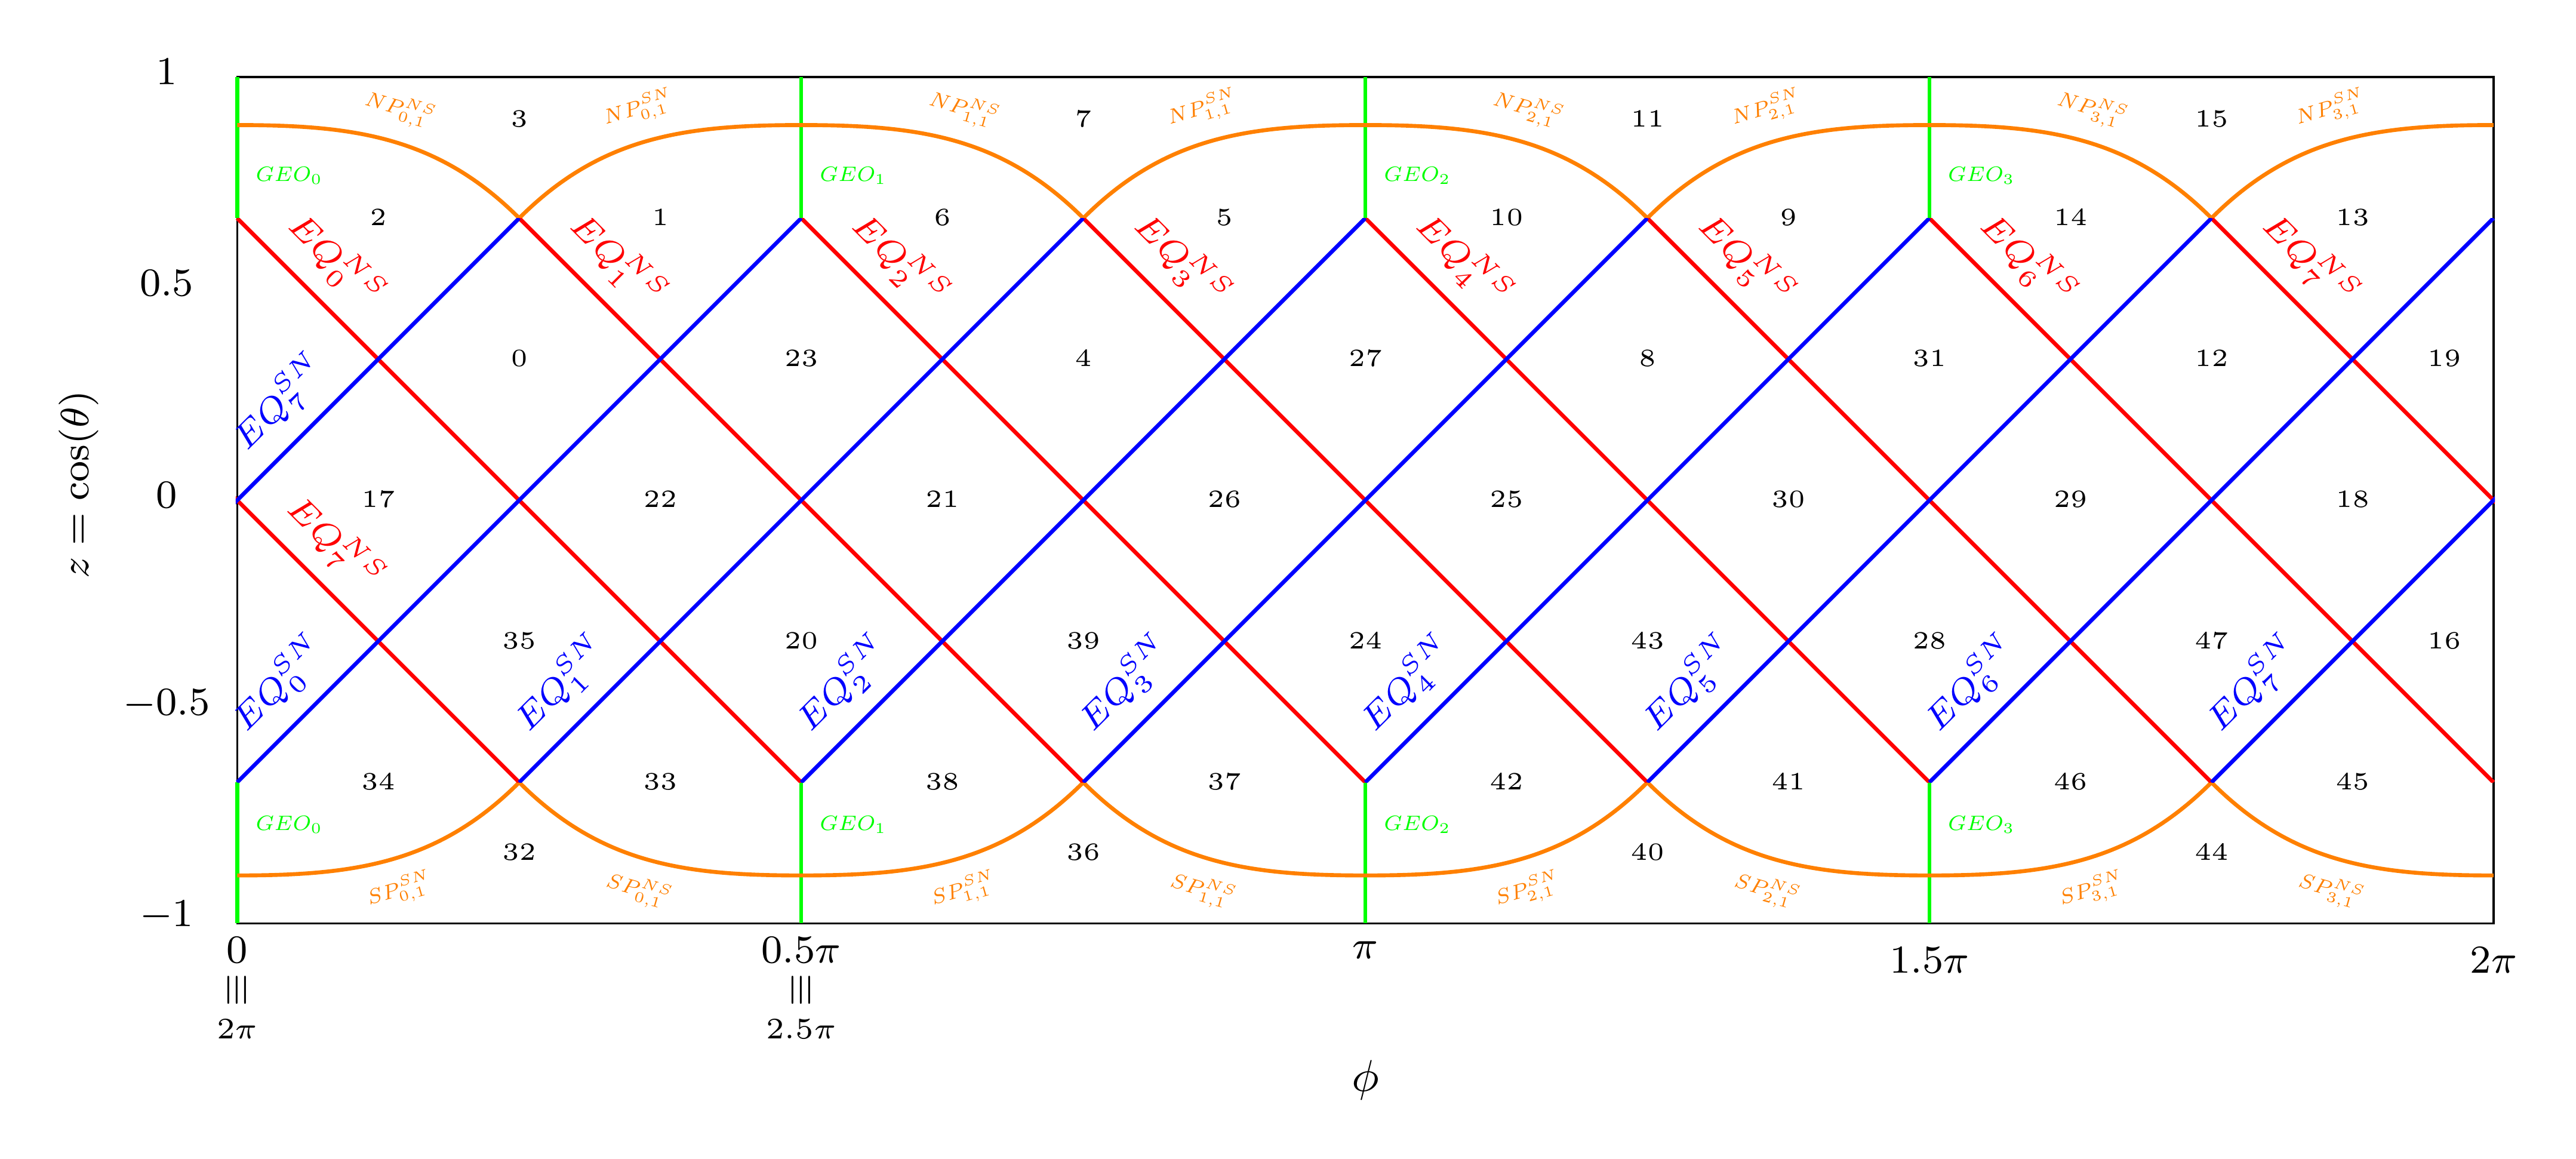
HEALPix

\documentclass[border=3mm,tikz]{standalone}

\usetikzlibrary{patterns, patterns.meta}
\usetikzlibrary{calc}
\usepackage{mathtools}

\newcommand{\verteq}{\rotatebox{90}{$\,\equiv$}}
\newcommand{\equivto}[2]{\underset{\scriptstyle\overset{\mkern0mu\verteq}{#2}}{#1}}

\pgfset{
  foreach/parallel foreach/.style args={#1in#2via#3}{evaluate=#3 as #1 using {{#2}[#3-1]}},
}

\begin{document}
\begin{tikzpicture}
%https://tikz.dev/library-patterns
\draw (-8, -3) rectangle (8,3);

\node[label={[shift={(0,-0.6)}]\footnotesize$2\pi$}] at (8,-3) {};
\node[label={[shift={(0,-1.1)}]\footnotesize$\equivto{0}{2\pi}$}] at (-8,-3) {};
%\node[label={[shift={(0,-1)}]\footnotesize$\equiv2\pi$}] at (-8,-3) {};

\node[label={[shift={(0,-0.5)}]\footnotesize$\pi$}] at (0,-3) {};
\node[label={[shift={(0,-1)}]\small\textbf{$\phi$}}] at (0,-3.5) {};

\node[label={[shift={(0,-1.1)}]\footnotesize$\equivto{0.5\pi}{2.5\pi}$}] at (-4,-3) {};
\node[label={[shift={(0,-0.6)}]\footnotesize$1.5\pi$}] at (4,-3) {};

\node[label={[shift={(-0.5,-0.3)}]\footnotesize$-1$}] at (-8,-3) {};
\node[label={[shift={(-0.5,-0.3)}]\footnotesize$0$}] at (-8,0) {};

\node[label={[shift={(-0.5,-0.3)}]\footnotesize$1$}] at (-8,3) {};
\node[label={[label distance=0.1cm, rotate=90]left:\footnotesize\textbf{$z=\cos(\theta)$}}] at (-9,1) {};

\node[label={[shift={(-0.5,-0.3)}]\footnotesize$-0.5$}] at (-8,-1.5) {};
\node[label={[shift={(-0.5,-0.3)}]\footnotesize$0.5$}] at (-8,1.5) {};

%Geodesic
\draw[green,thick] (-8,-2) -- node[right, font=\scriptsize, pos=0.3]{\scalebox{0.6}{$GEO_0$}}(-8,-3);
\draw[green,thick](-4,-2) -- node[right, font=\scriptsize, pos=0.3]{\scalebox{0.6}{$GEO_1$}}(-4,-3);
\draw [green,thick](0,-2) -- node[right, font=\scriptsize, pos=0.3]{\scalebox{0.6}{$GEO_2$}}(0,-3);
\draw[green,thick] (4,-2) -- node[right, font=\scriptsize, pos=0.3]{\scalebox{0.6}{$GEO_3$}}(4,-3);

\draw[green,thick] (-8,2) -- node[right, font=\scriptsize, pos=0.3]{\scalebox{0.6}{$GEO_0$}}(-8,3);
\draw [green,thick](-4,2) -- node[right, font=\scriptsize, pos=0.3]{\scalebox{0.6}{$GEO_1$}}(-4,3);
\draw [green,thick](0,2) -- node[right, font=\scriptsize, pos=0.3]{\scalebox{0.6}{$GEO_2$}}(0,3);
\draw [green,thick](4,2) -- node[right, font=\scriptsize, pos=0.3]{\scalebox{0.6}{$GEO_3$}}(4,3);

%Polar interior berders
%Top
\draw[orange,thick] (-2,2)  to[out=45, in=180] node[above, font=\scriptsize, pos=0.5, sloped]{\scalebox{.6}{$NP^{SN}_{1,1}$}} (0, 2.66);
\draw[orange,thick] (-2,2) to[out=135, in=0] node[above, font=\scriptsize, pos=0.5, sloped]{\scalebox{.6}{$NP^{NS}_{1,1}$}}(-4, 2.66);

\draw [orange,thick](-6,2) to[out=45, in=180] node[above, font=\scriptsize, pos=0.5, sloped]{\scalebox{.6}{$NP^{SN}_{0,1}$}} (-4, 2.66);
\draw[orange,thick] (-6,2) to[out=135, in=0] node[above, font=\scriptsize, pos=0.5, sloped]{\scalebox{.6}{$NP^{NS}_{0,1}$}} (-8, 2.66);

\draw [orange,thick](2,2) to[out=135, in=0] node[above, font=\scriptsize, pos=0.5, sloped]{\scalebox{.6}{$NP^{NS}_{2,1}$}} (0, 2.66);
\draw [orange,thick](2,2) to[out=45, in=180] node[above, font=\scriptsize, pos=0.5, sloped]{\scalebox{.6}{$NP^{SN}_{2,1}$}} (4, 2.66);

\draw [orange,thick](6,2) to[out=135, in=0] node[above, font=\scriptsize, pos=0.5, sloped]{\scalebox{.6}{$NP^{NS}_{3,1}$}} (4, 2.66);
\draw [orange,thick](6,2) to[out=45, in=180] node[above, font=\scriptsize, pos=0.5, sloped]{\scalebox{.6}{$NP^{SN}_{3,1}$}} (8, 2.66);

%DOWN
\draw [orange,thick](-2,-2) to[out=-45, in=180] node[below, font=\scriptsize, pos=0.5, sloped]{\scalebox{.6}{$SP^{NS}_{1,1}$}} (0, -2.66) ;
\draw [orange,thick](-2,-2) to[out=225, in=0] node[below, font=\scriptsize, pos=0.5, sloped]{\scalebox{.6}{$SP^{SN}_{1,1}$}} (-4, -2.66);

\draw [orange,thick](-6,-2) to[out=-45, in=180] node[below, font=\scriptsize, pos=0.5, sloped]{\scalebox{.6}{$SP^{NS}_{0,1}$}}(-4, -2.66);
\draw[orange,thick] (-6,-2) to[out=225, in=0]node[below, font=\scriptsize, pos=0.5, sloped]{\scalebox{.6}{$SP^{SN}_{0,1}$}} (-8, -2.66);

\draw[orange,thick] (2,-2) to[out=225, in=0] node[below, font=\scriptsize, pos=0.5, sloped]{\scalebox{.6}{$SP^{SN}_{2,1}$}} (0, -2.66);
\draw [orange,thick](2,-2) to[out=-45, in=180] node[below, font=\scriptsize, pos=0.5, sloped]{\scalebox{.6}{$SP^{NS}_{2,1}$}} (4, -2.66);

\draw[orange,thick] (6,-2) to[out=225, in=0] node[below, font=\scriptsize, pos=0.5, sloped]{\scalebox{.6}{$SP^{SN}_{3,1}$}} (4, -2.66);
\draw [orange,thick](6,-2) to[out=-45, in=180] node[below, font=\scriptsize, pos=0.5, sloped]{\scalebox{.6}{$SP^{NS}_{3,1}$}} (8, -2.66);

%\fill [pattern={Lines[angle=45,distance=1.4142135623730951cm, yshift=1cm]},pattern color=red ] (-8,-2) rectangle (8,2);
%\fill [pattern={Lines[angle=-45,distance=1.4142135623730951cm, yshift=0.35cm]},pattern color=blue ] (-8,-2) rectangle (8,2);


%Cuadrícula d'edició
%\draw[gray] (-8,-5) grid (8,5);


%Pixel indices
\node[label={[shift={(0.15,-0.3)}]\tiny$19$}] at (7.5,1) {};
\node[label={[shift={(0.15,-0.3)}]\tiny$16$}] at (7.5,-1) {};

\def\indices{0,...,3}
\def\secondlist{3,7,11,15}
\def\thirdlist{32,36,40,44}
\foreach \x [count=\t,
  parallel foreach=\a in \secondlist via \t,
  parallel foreach=\b in \thirdlist via \t]
  in \indices
  {
    \node[label={[shift={(0,-0.1)}]\tiny$\a$}] at (\x*4-6,2.5) {};
    \node[label={[shift={(0,-0.3)}]\tiny$\b$}] at (\x*4-6,-2.5) {};
  }

\def\indices{0,1,2,3,4,5,6,7}
\def\secondlist{2,1,6,5,10,9,14,13}
\def\thirdlist{17,22,21,26,25,30,29,18}
\def\fourthlist{34,33,38,37,42,41,46,45}
\foreach \x [count=\t,
  parallel foreach=\a in \secondlist via \t,
  parallel foreach=\b in \thirdlist via \t,
  parallel foreach=\c in \fourthlist via \t]
  in \indices
  {
    \node[label={[shift={(0,-0.3)}]\tiny$\a$}] at (\x*2-7,2) {};
    \node[label={[shift={(0,-0.3)}]\tiny$\b$}] at (\x*2-7,0) {};
    \node[label={[shift={(0,-0.3)}]\tiny$\c$}] at (\x*2-7,-2) {};
  }

\def\indices{0,...,6}
\def\secondlist{0,23,4,27,8,31,12}
\def\thirdlist{35,20,39,24,43,28,47}
\foreach \x [count=\t,
  parallel foreach=\a in \secondlist via \t,
  parallel foreach=\b in \thirdlist via \t]
  in \indices
  {
    \node[label={[shift={(0,-0.3)}]\tiny$\a$}] at (\x*2-6,1) {};
    \node[label={[shift={(0,-0.3)}]\tiny$\b$}] at (\x*2-6,-1) {};
  }

%Clip de les vores dels equatorials
\clip (-8.01,-2) rectangle (8.01,2);

%Vores dels equatorials i noms
\edef\index{0};
\foreach \x in {-10,-8,-6,-4,-2,0, 2,4,6}
{
    \pgfmathtruncatemacro\index{\x/2 + 4}
    \draw[red, thick] (\x,2) -- node[very near start, above, font=\scriptsize, sloped]{$EQ^{NS}_{\index}$} (\x+4,-2);

}
\draw[red] (-8,0) -- node[near start, above,font=\scriptsize, sloped]{$EQ^{NS}_{7}$} (-6,-2);

\foreach \y in {-6,-4,-2,0,2,4,6,8,10}
{
    \pgfmathtruncatemacro\index{\y/2 + 2}
    \draw[blue, thick] (\y,2) -- node[very near end, above, font=\scriptsize, sloped]{$EQ^{SN}_{\index}$}(\y-4,-2);
}
\draw[blue] (-8,0) -- node[near start, above,font=\scriptsize, sloped]{$EQ^{SN}_{7}$} (-6,2);


% new grid
\begin{scope}[cm={1,1,  % new x axis
                  -1,1,   % new y axis
                 (0,0)}] % new origin

%\node[fill,circle,minimum size=3pt,inner sep=0,label={[right]B}] at (1,1) {};
%\fill[red, opacity=0.3] (-3,2) rectangle (-2,3);
%\fill[red, opacity=0.3] (-3,1) rectangle (-2,2);

%\draw[black] (-5,-5) grid (5,5);

\end{scope}


%\node[fill,circle,minimum size=3pt,inner sep=0,label={[right]A}] at (1,1) {};
%\draw[thick,-latex] (-3.5,0) -- (3.5,0);
%\draw[thick,-latex] (0,-3.5) -- (0,3.5);
\end{tikzpicture}
\end{document}
